Assessing the July Fourth Flood Events in Central Texas: A Preliminary Analysis
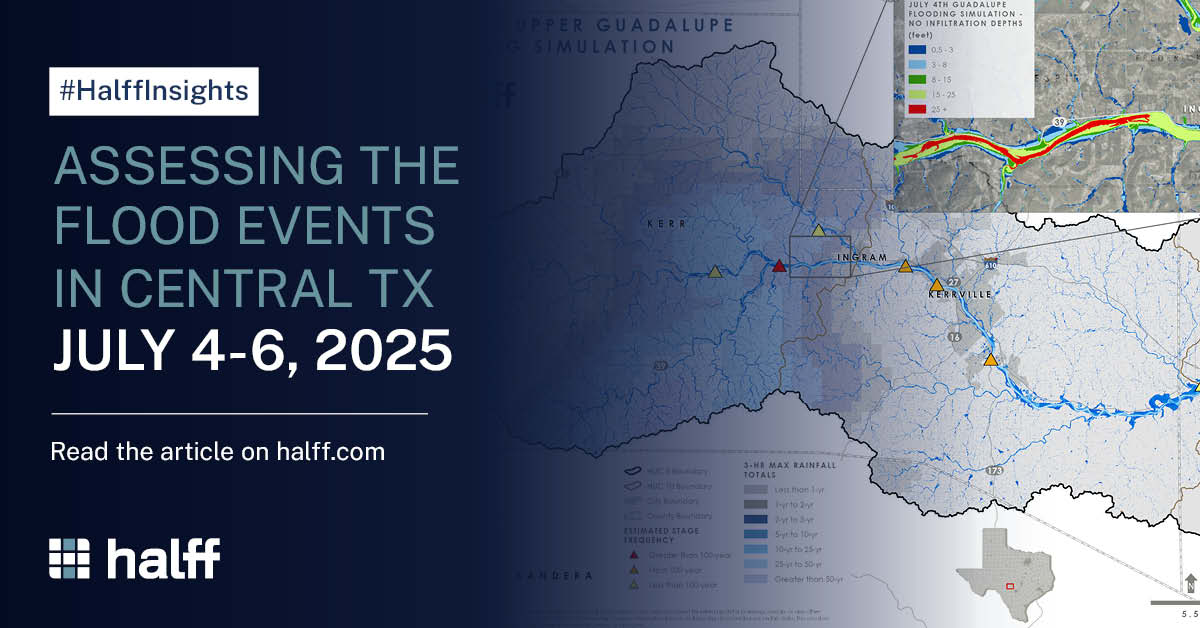
The 2025 July Fourth weekend will be remembered with deep sorrow across Central Texas. What began as a holiday weekend of celebration turned into a devastating flood event that brought tragedy to numerous communities. A persistent and intense storm system moved across the Hill Country, releasing record-breaking rainfall over several days, particularly from July 4 through July 5.
In a region known as “Flash Flood Alley” — stretching from the Edwards Plateau through Central Texas — topographic, geologic and climatological conditions make the area especially prone to sudden, destructive flooding. This event was no exception.
Many lives were lost, and numerous homes and businesses were damaged or destroyed. The loss of life and hardship endured by these communities weighs heavily on our hearts.
At Halff, our mission to improve lives and communities is more than a statement — it’s a call to act. In the wake of this tragedy, our Water Resources team quickly mobilized to assess the magnitude of the storm and help inform recovery and planning efforts.
Mobilization
Immediately following the onset of the storm, Halff’s Water Resources team began monitoring and documenting conditions across Central Texas. Drawing on a culture of proactive service, our team utilized a range of publicly available data to track rainfall, stream gages and flood warnings. In addition to a variety of local and regional sources, the statewide sources included:
In addition to virtual monitoring, Halff staff in the field documented high water marks in areas around our offices and where we are actively supporting local communities. These physical observations are critical in validating our models and understanding the real-world impacts of the storms.
Halff leveraged newly developed, non-proprietary 2D Base Level Engineering (BLE) models — provided by FEMA Region 6 and the Texas Water Development Board (TWDB) — to perform rapid assessments of flood behavior in the Upper Guadalupe, San Gabriel and San Saba watersheds. Our team requested use of these models early to support informed evaluations of storm magnitude and flood impacts. The teams also used available datasets, including rainfall data and gage records, to evaluate how rainfall contributed to flood movement.
Rainfall Observations
In 2018, the National Oceanic and Atmospheric Administration (NOAA) released updated precipitation-frequency values for Texas. The publication, Atlas 14, reassesses historical rainfall data up to 2017, adding 20 years of records to the previous analysis. NOAA Atlas 14 rainfall data are typically used under the assumption that rain falls uniformly across an entire watershed over 24 hours when generating floodplains. According to NOAA Atlas 14, the estimated 100-year rainfall event is greater than previously assessed. The most significant increases in rainfall estimates were observed in Central Texas and along the Texas coast.
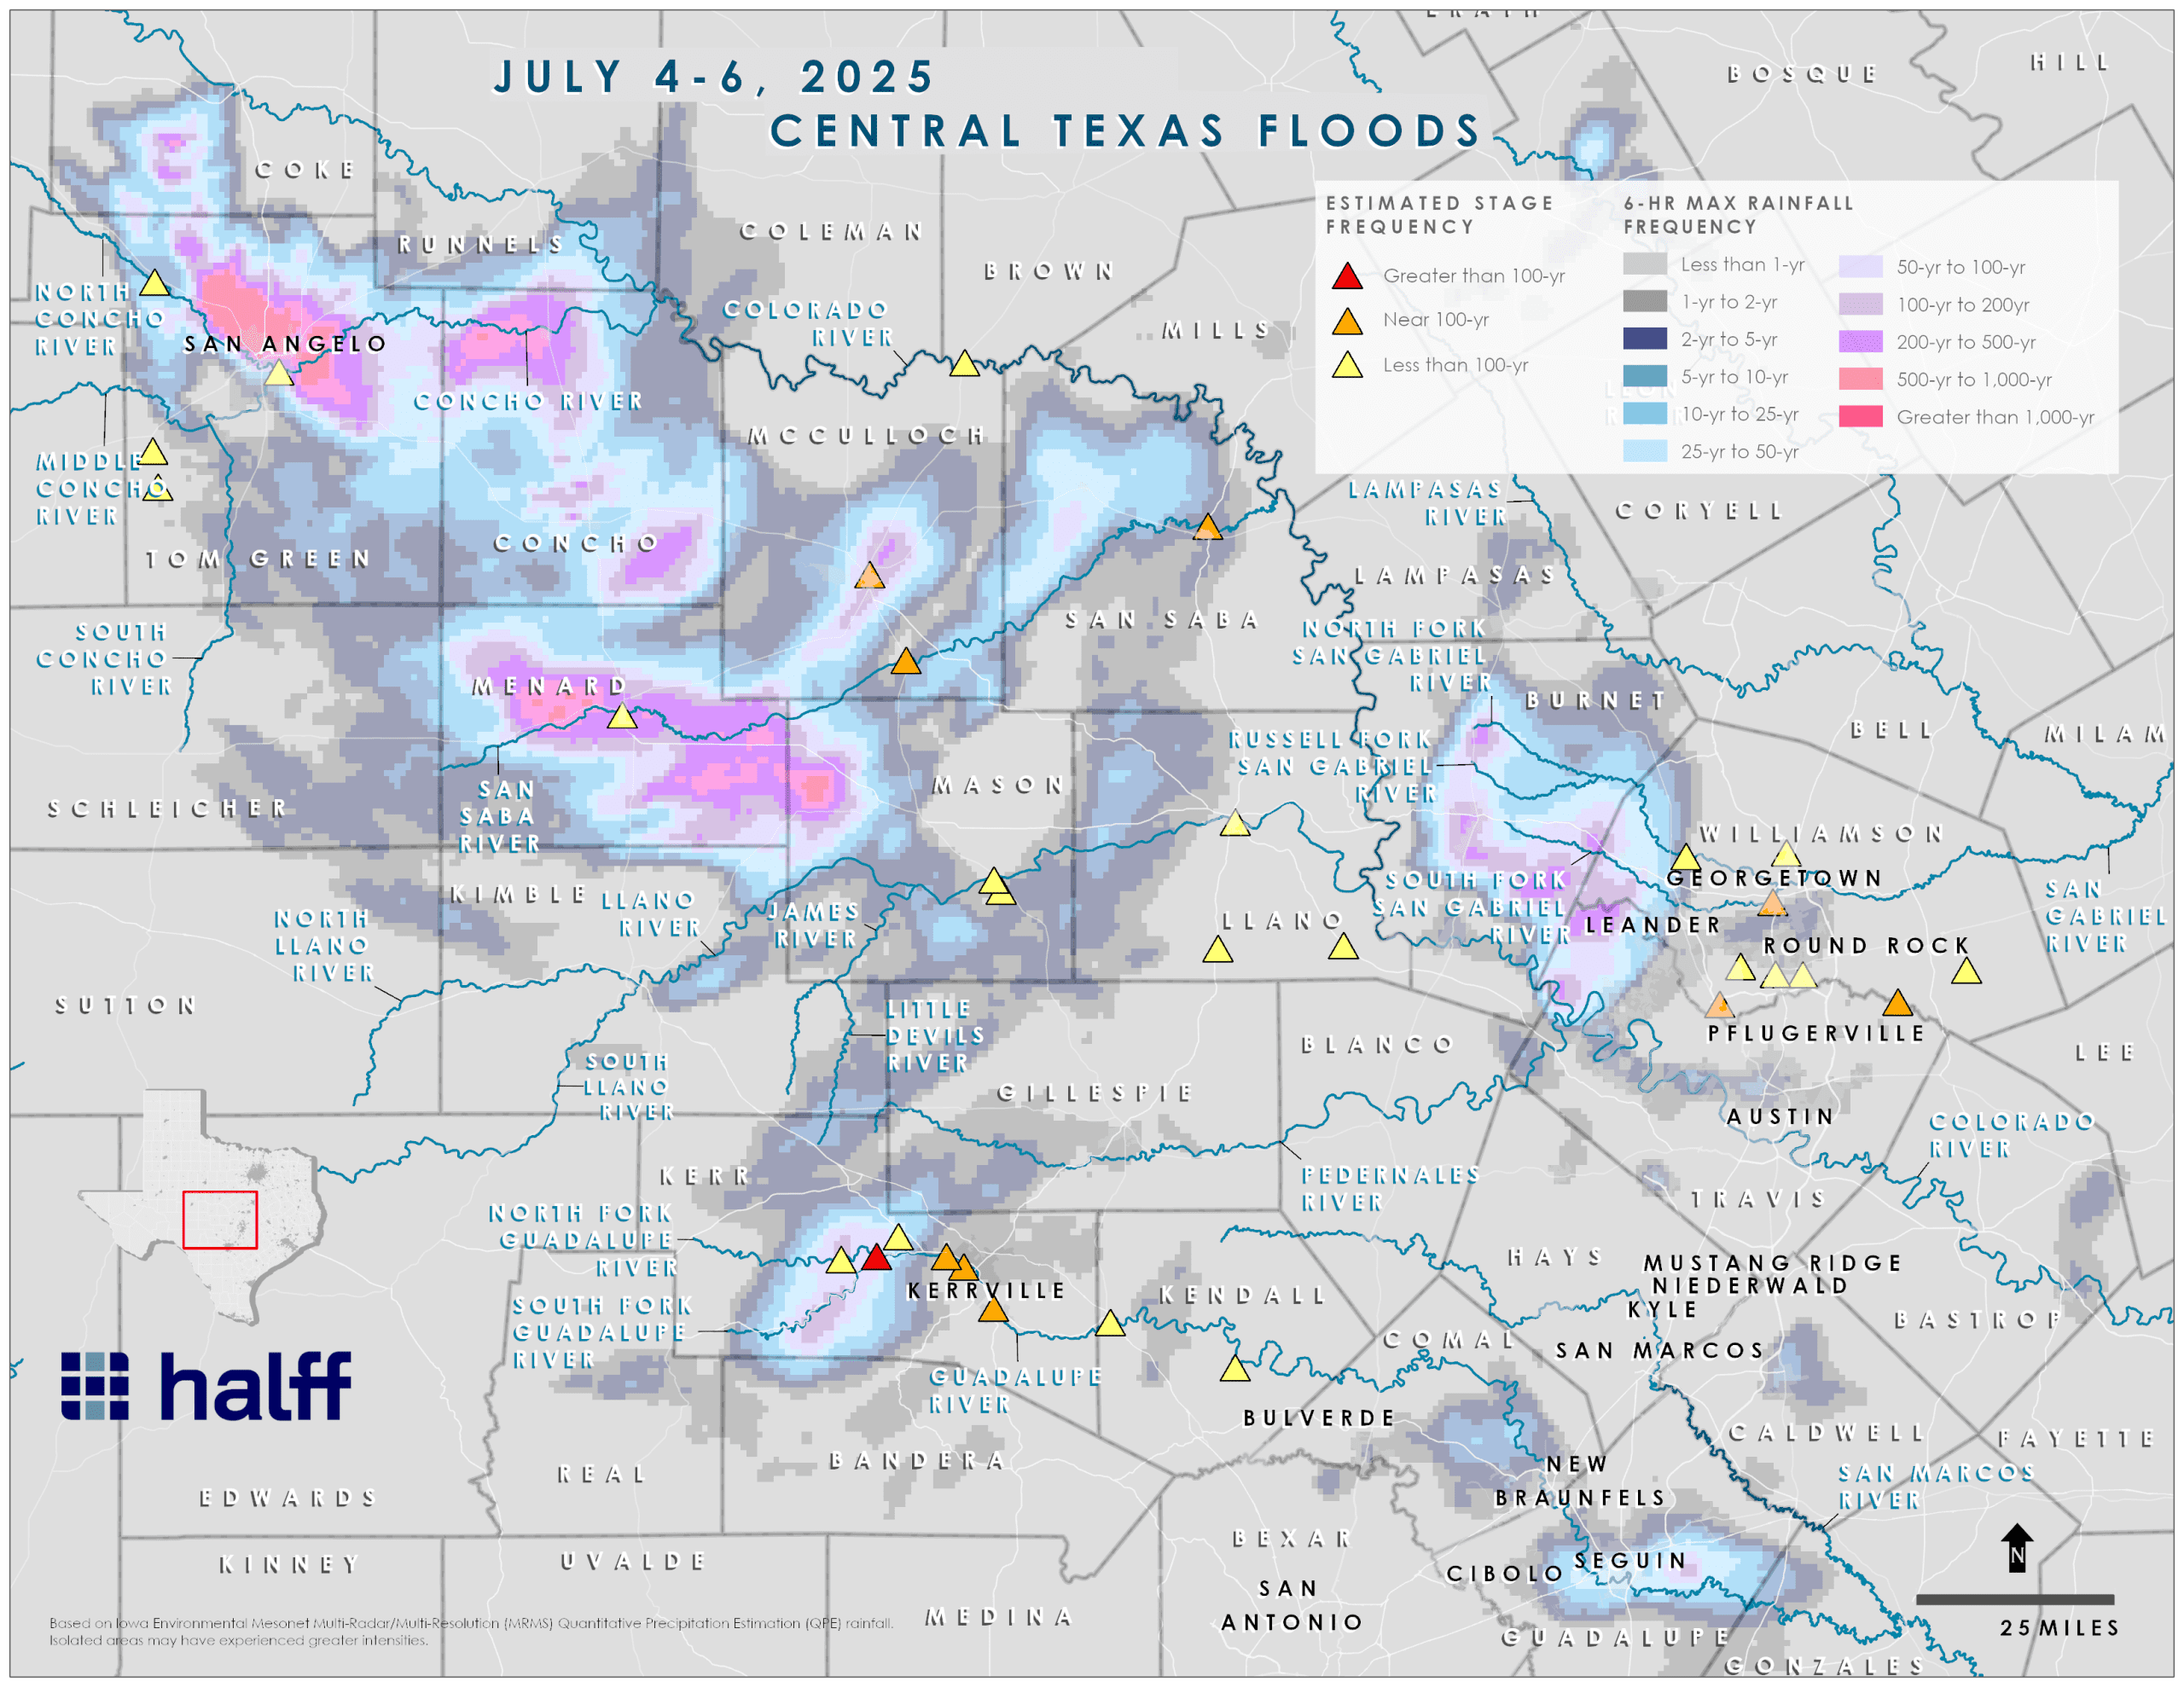
Post-event rainfall analysis was conducted using gridded hourly precipitation data derived from the Multi-Radar/Multi-Sensor (MRMS) Quantitative Precipitation Estimation (QPE) dataset. This dataset, which includes gage bias correction, provided the best available gridded rainfall product for immediate post-event evaluation.
Halff’s internal precipitation tools compared observed rainfall against NOAA Atlas 14 return frequencies. The rainfall analysis showed highly variable patterns of intensity, depth and duration across the impacted region.
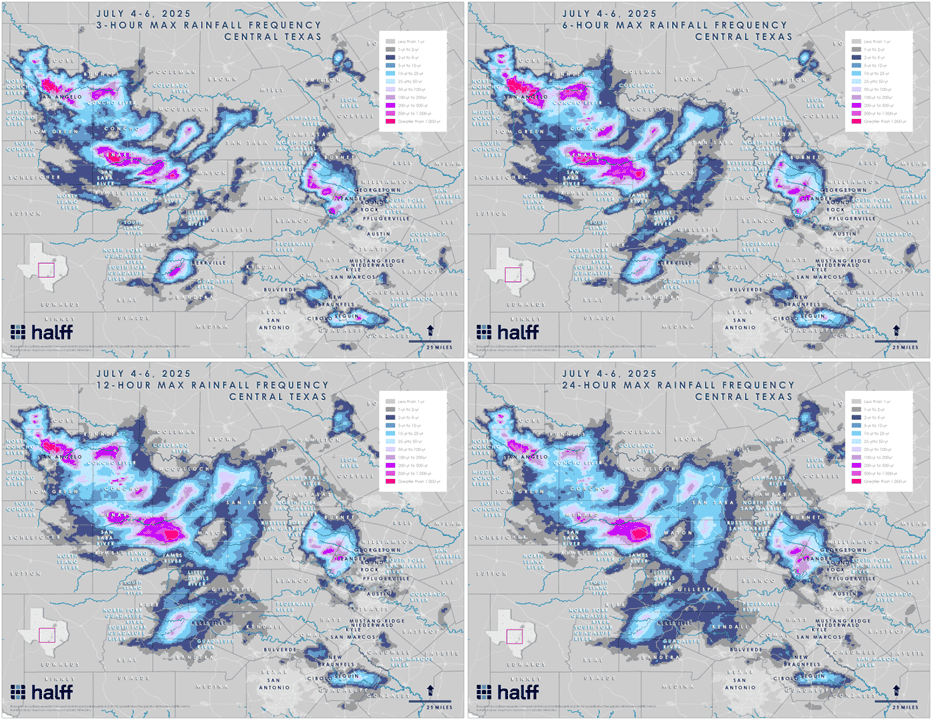
Disclaimer: Estimated frequencies are based on Iowa Environmental Mesonet Multi-Radar/Multi-Resolution (MRMS) Quantitative Precipitation Estimation (QPE) gridded hourly rainfall relative to NOAA Atlas 14 frequencies. Isolated areas may have experienced greater intensities.
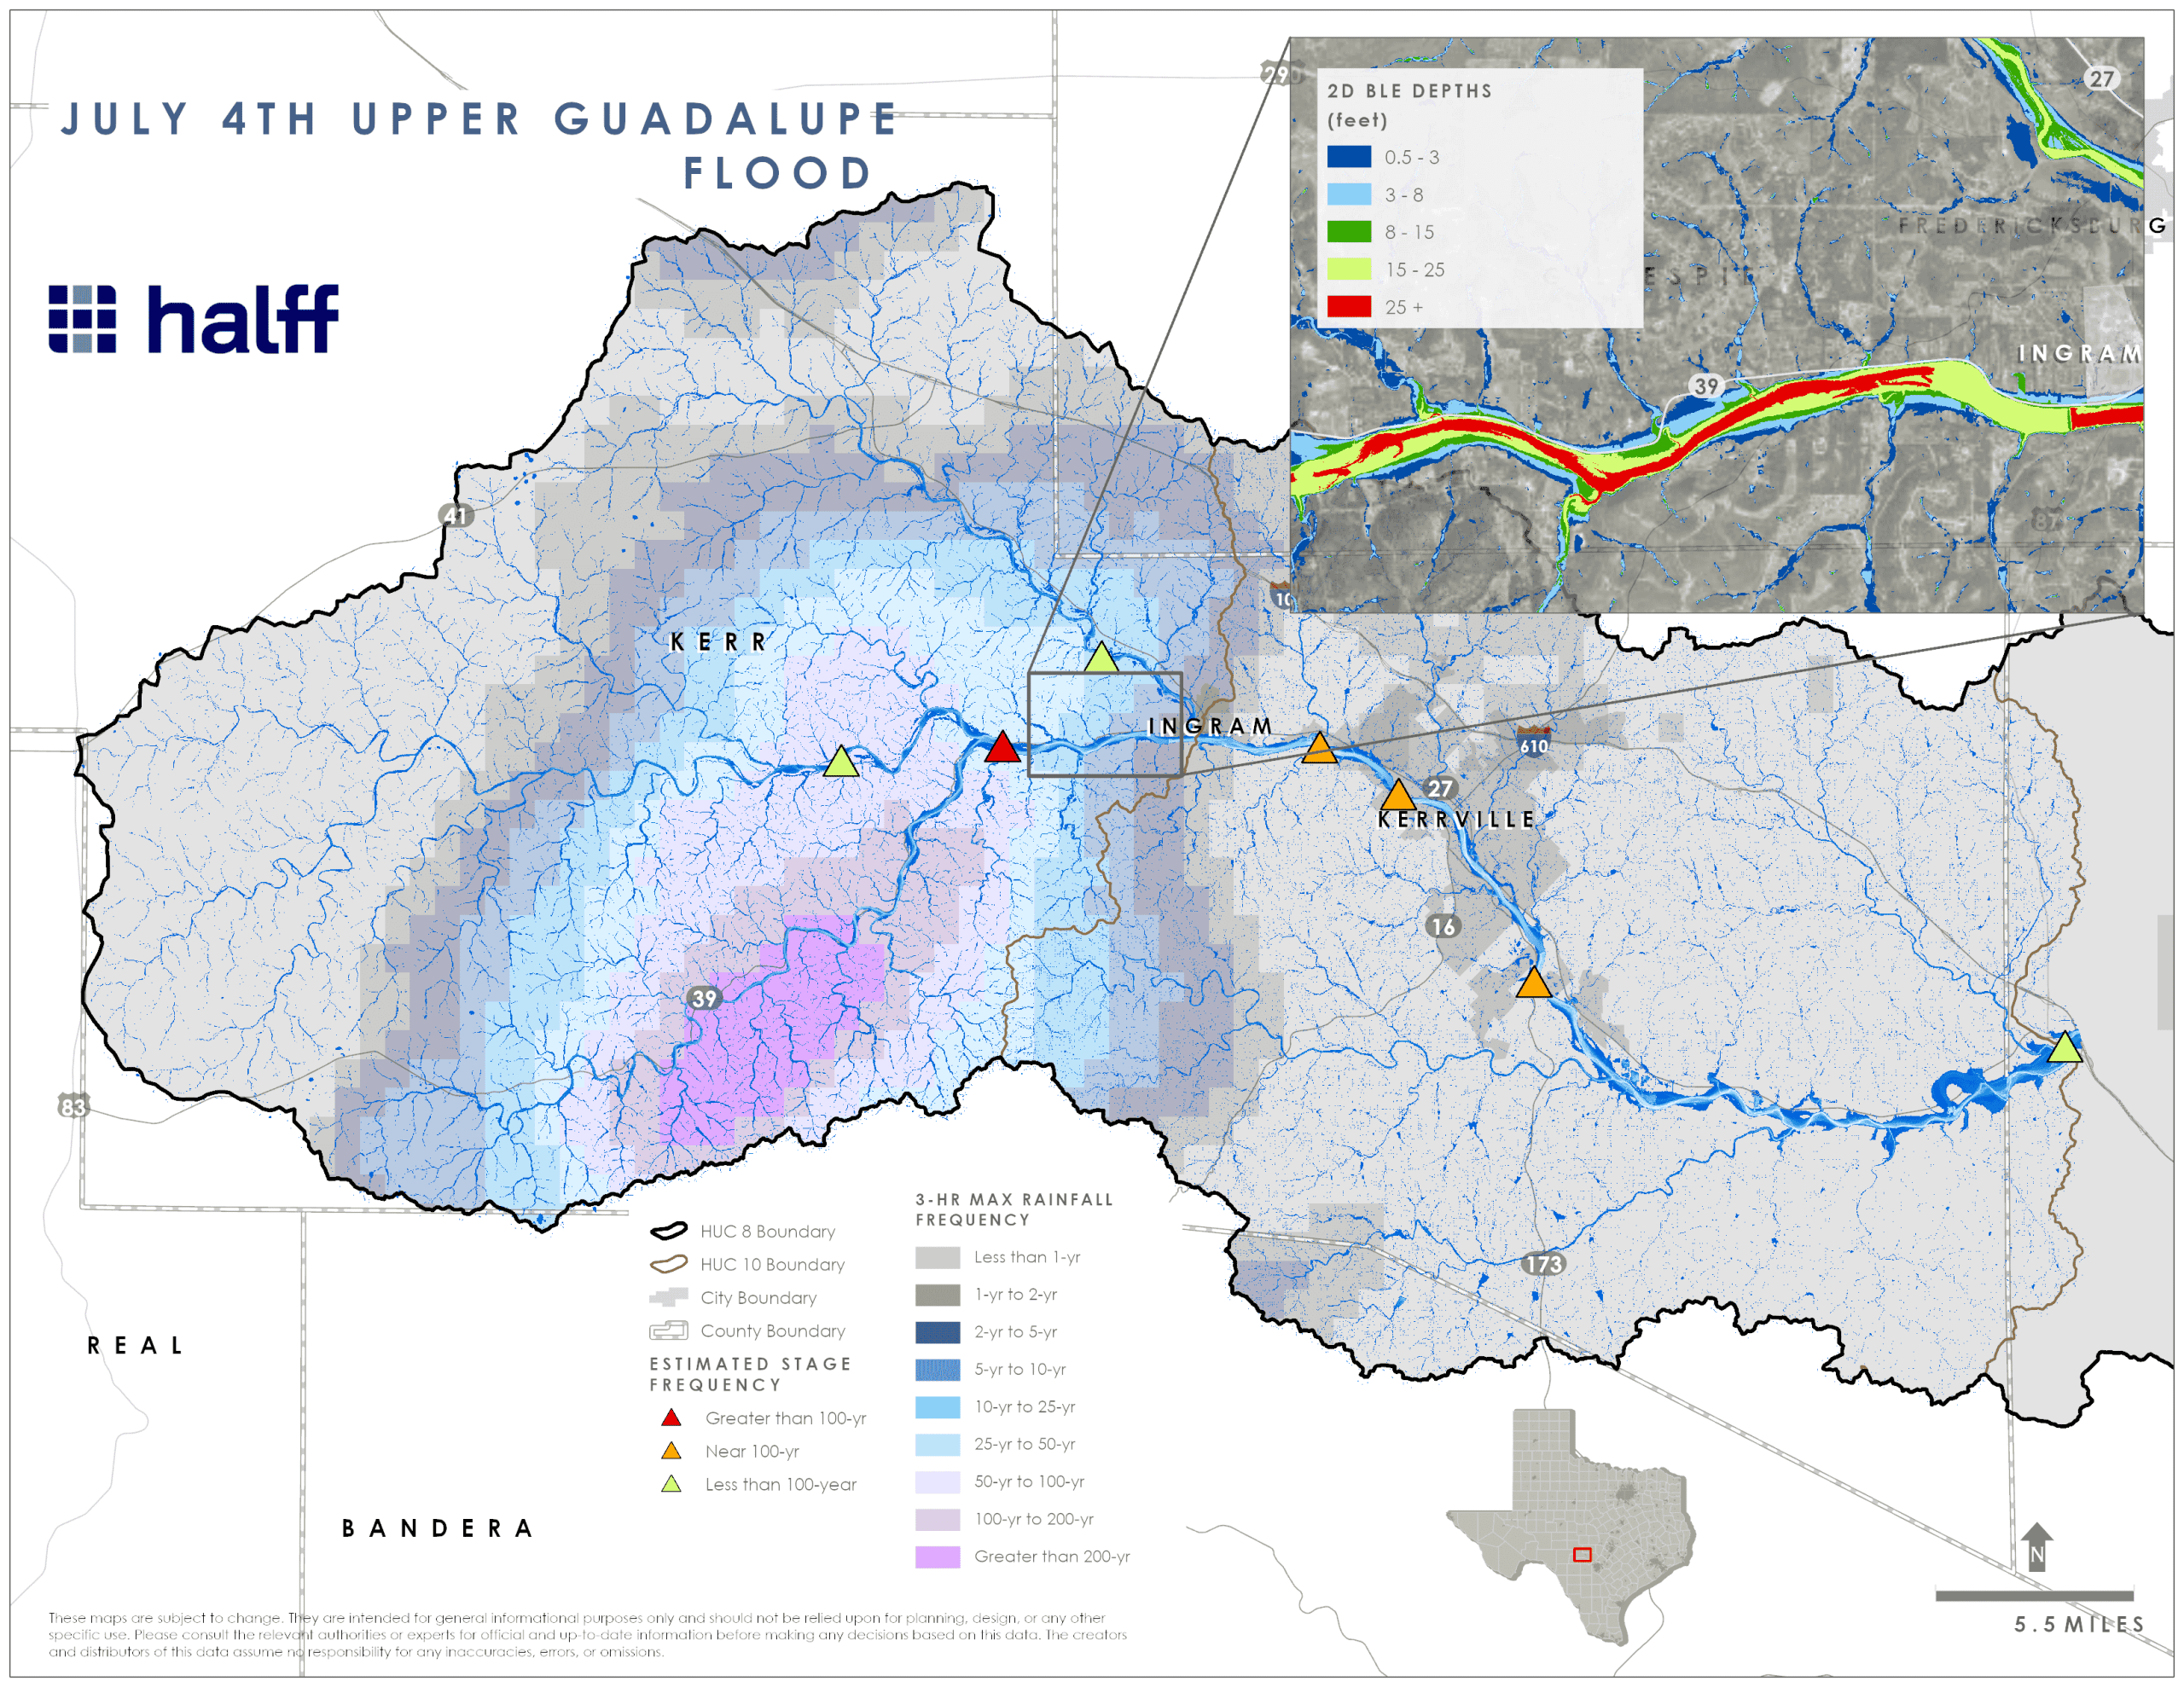
Upper Guadalupe Watershed (July 4, 2025)
Analysis showed that the Upper Guadalupe River watershed, particularly along the South Fork Guadalupe River, experienced rainfall totals consistent with 100-year to 500-year return period events, depending on the rainfall duration (ranging from three-hour to 24-hour intervals). One of the most severe flood wave peaks occurred near 5 a.m. on July 4 at the Hunt gage, suggesting a short-duration, high-intensity rainfall triggered this event.
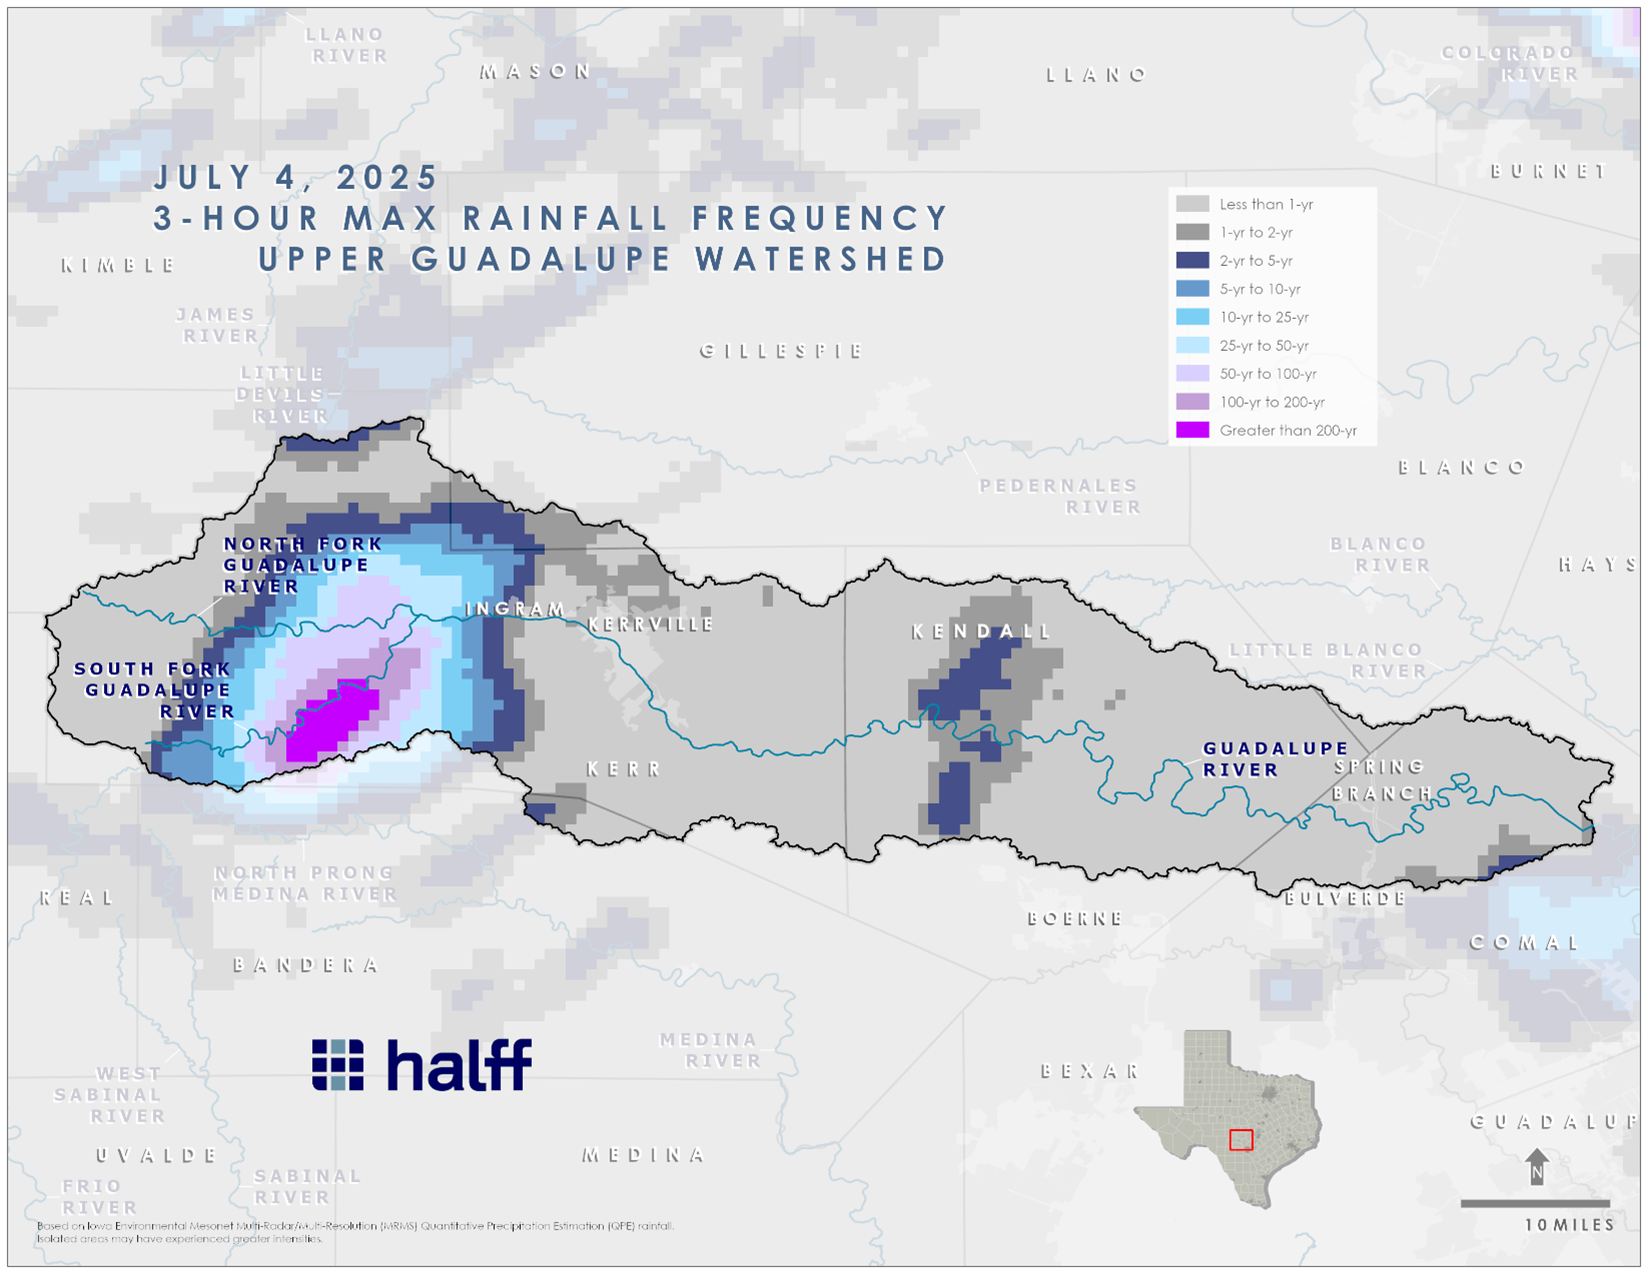
The most extreme frequencies in this watershed were observed in a three-hour duration.
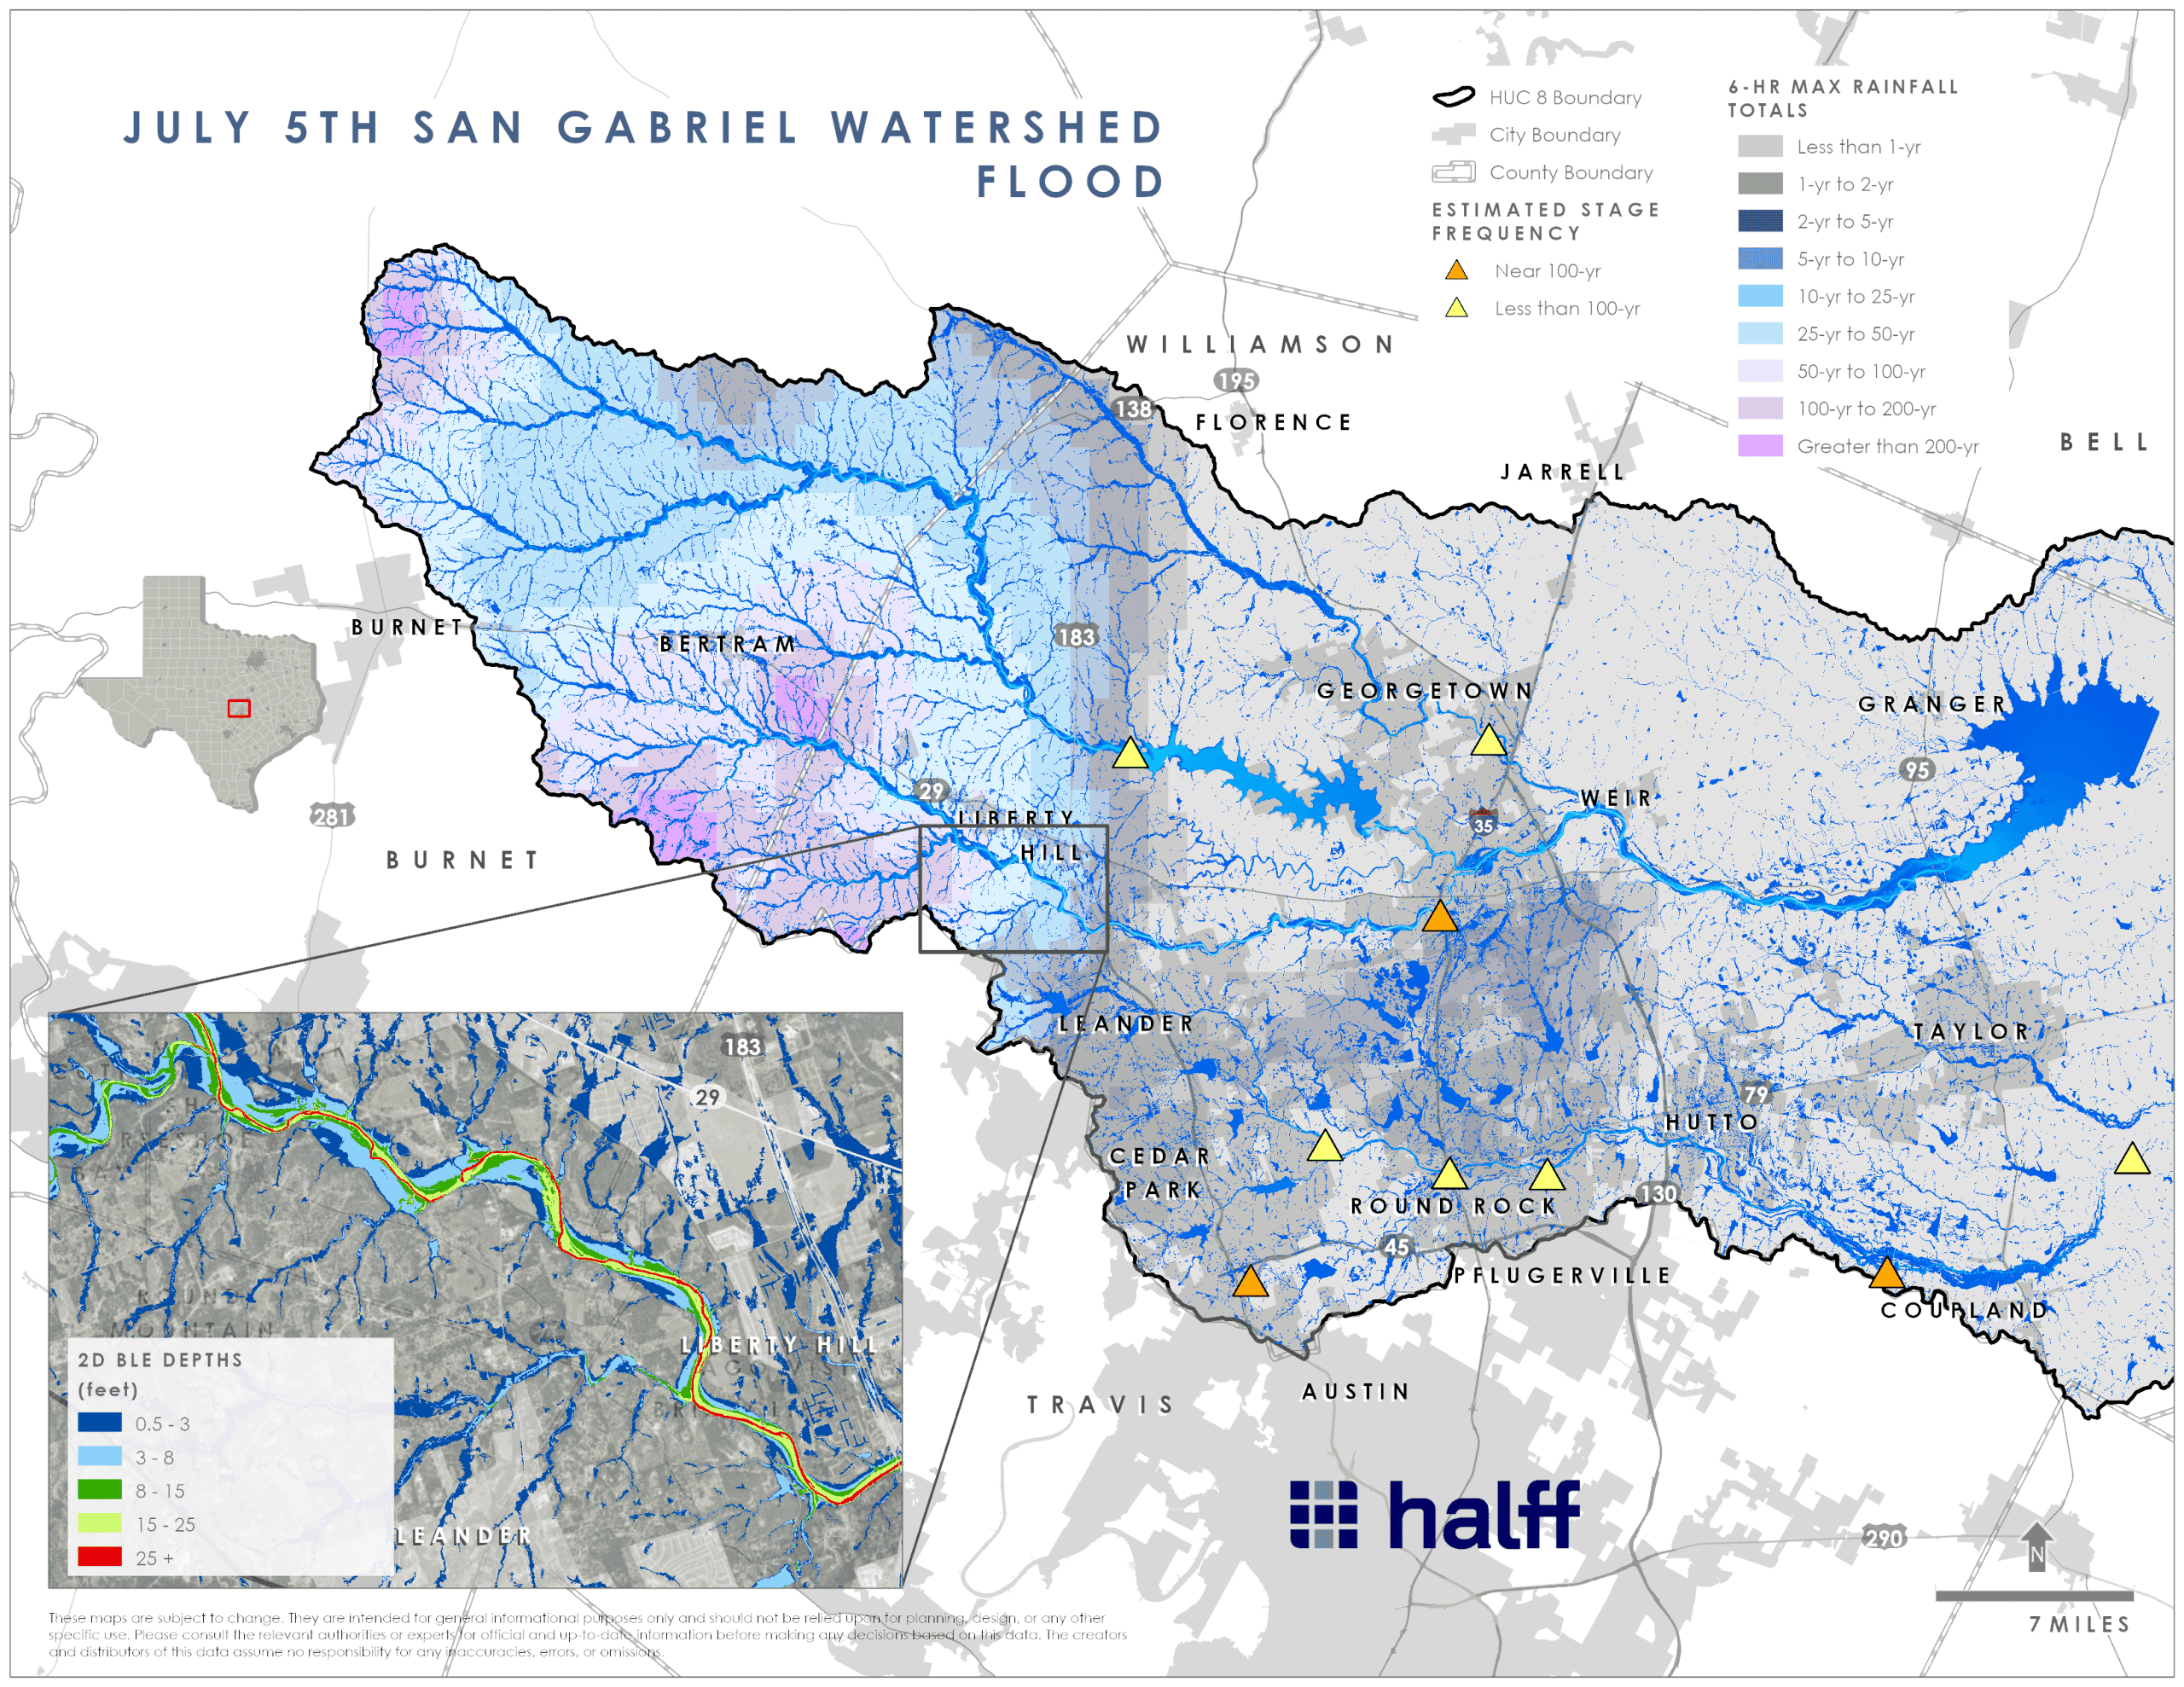
San Gabriel Watershed (July 5, 2025)
The upstream portion of the San Gabriel watershed, especially in the Bertram and Liberty Hill areas, experienced rainfall amounts consistent with 100-year to greater than 200-year return period events, depending on rainfall duration (ranging from three-hour to 24-hour intervals). Swift water rescues near 6 a.m. on July 5 at the Burnet and Williamson County boundary suggests a short-duration, high-intensity rainfall triggered this event.
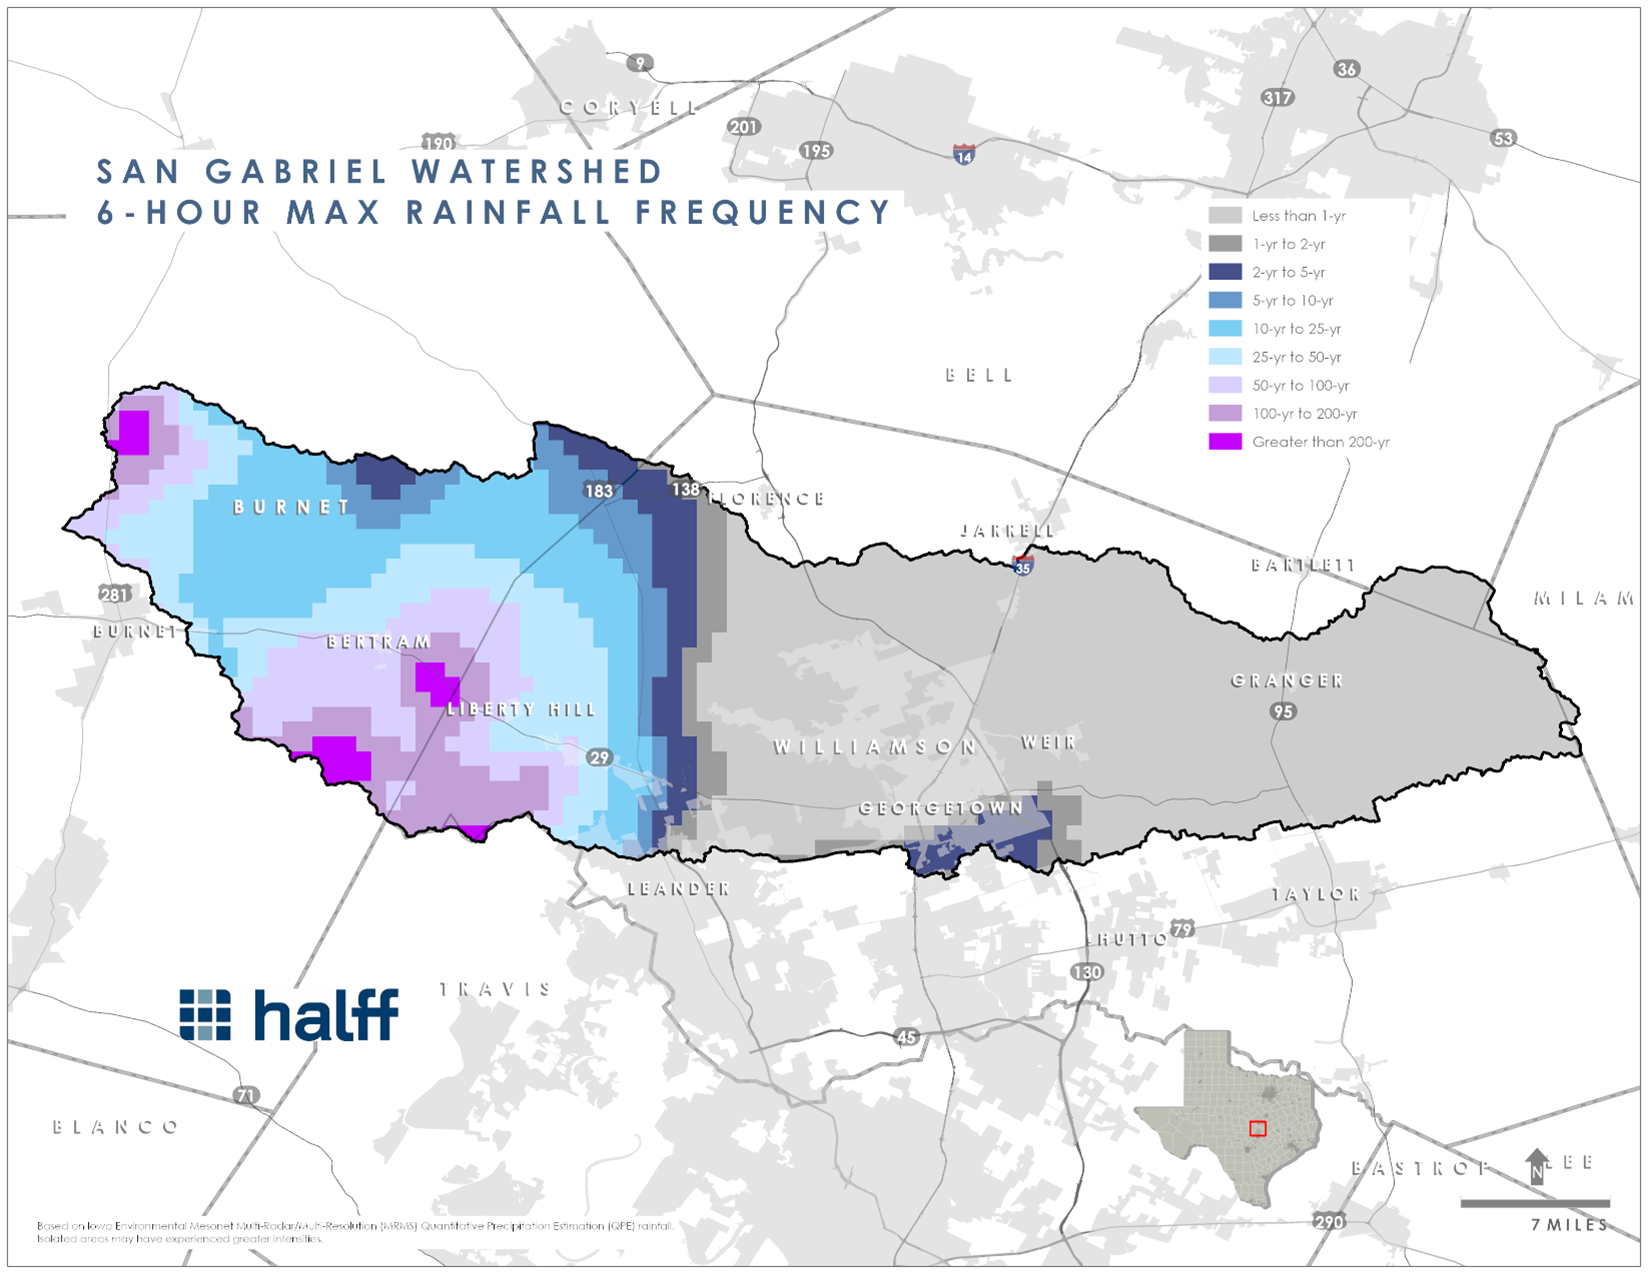
The most extreme frequencies in this watershed were observed in a six-hour duration.
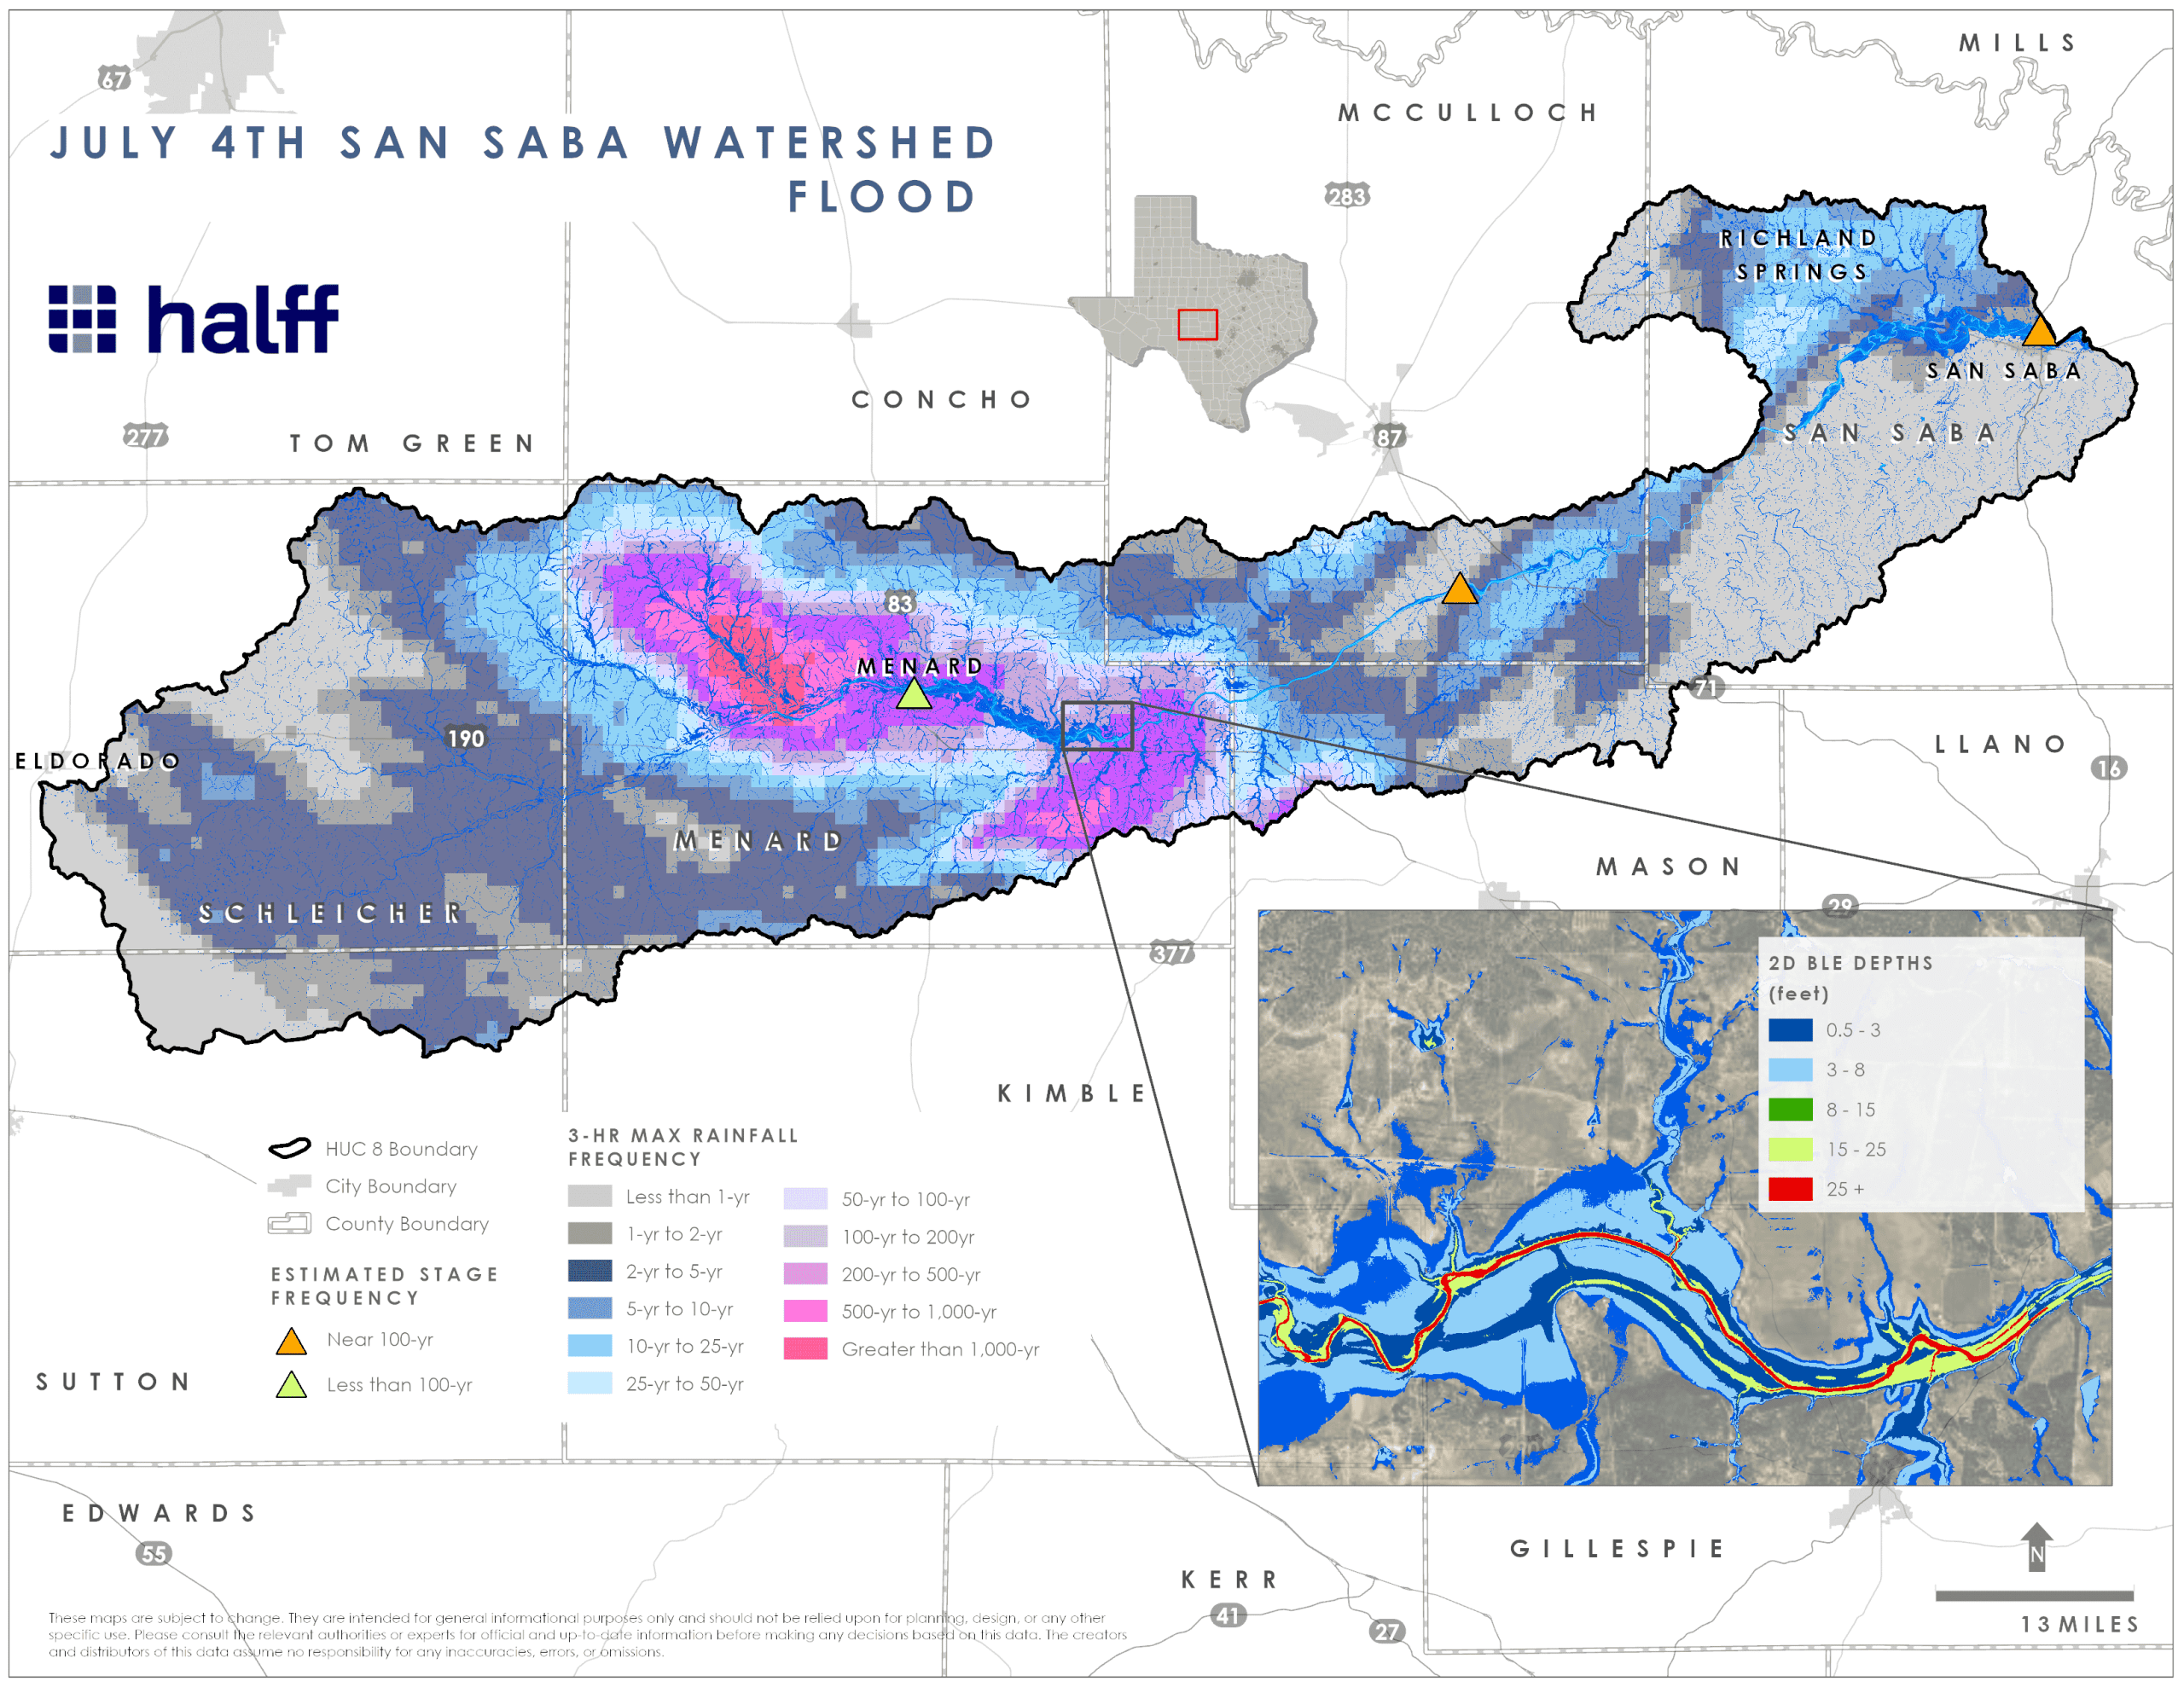
San Saba Watershed (July 4, 2025)
A significant portion of the San Saba watershed in the Menard area experienced three-hour to 24-hour rainfall total ranging from the 100-year to greater than the 1,000-year return period events. Rainfall data shows that Menard experienced the most intense three-hour rainfall frequencies, while the highest 12- and 24-hour rainfall frequencies occurred south of the San Saba River near the Menard and Mason County boundary.
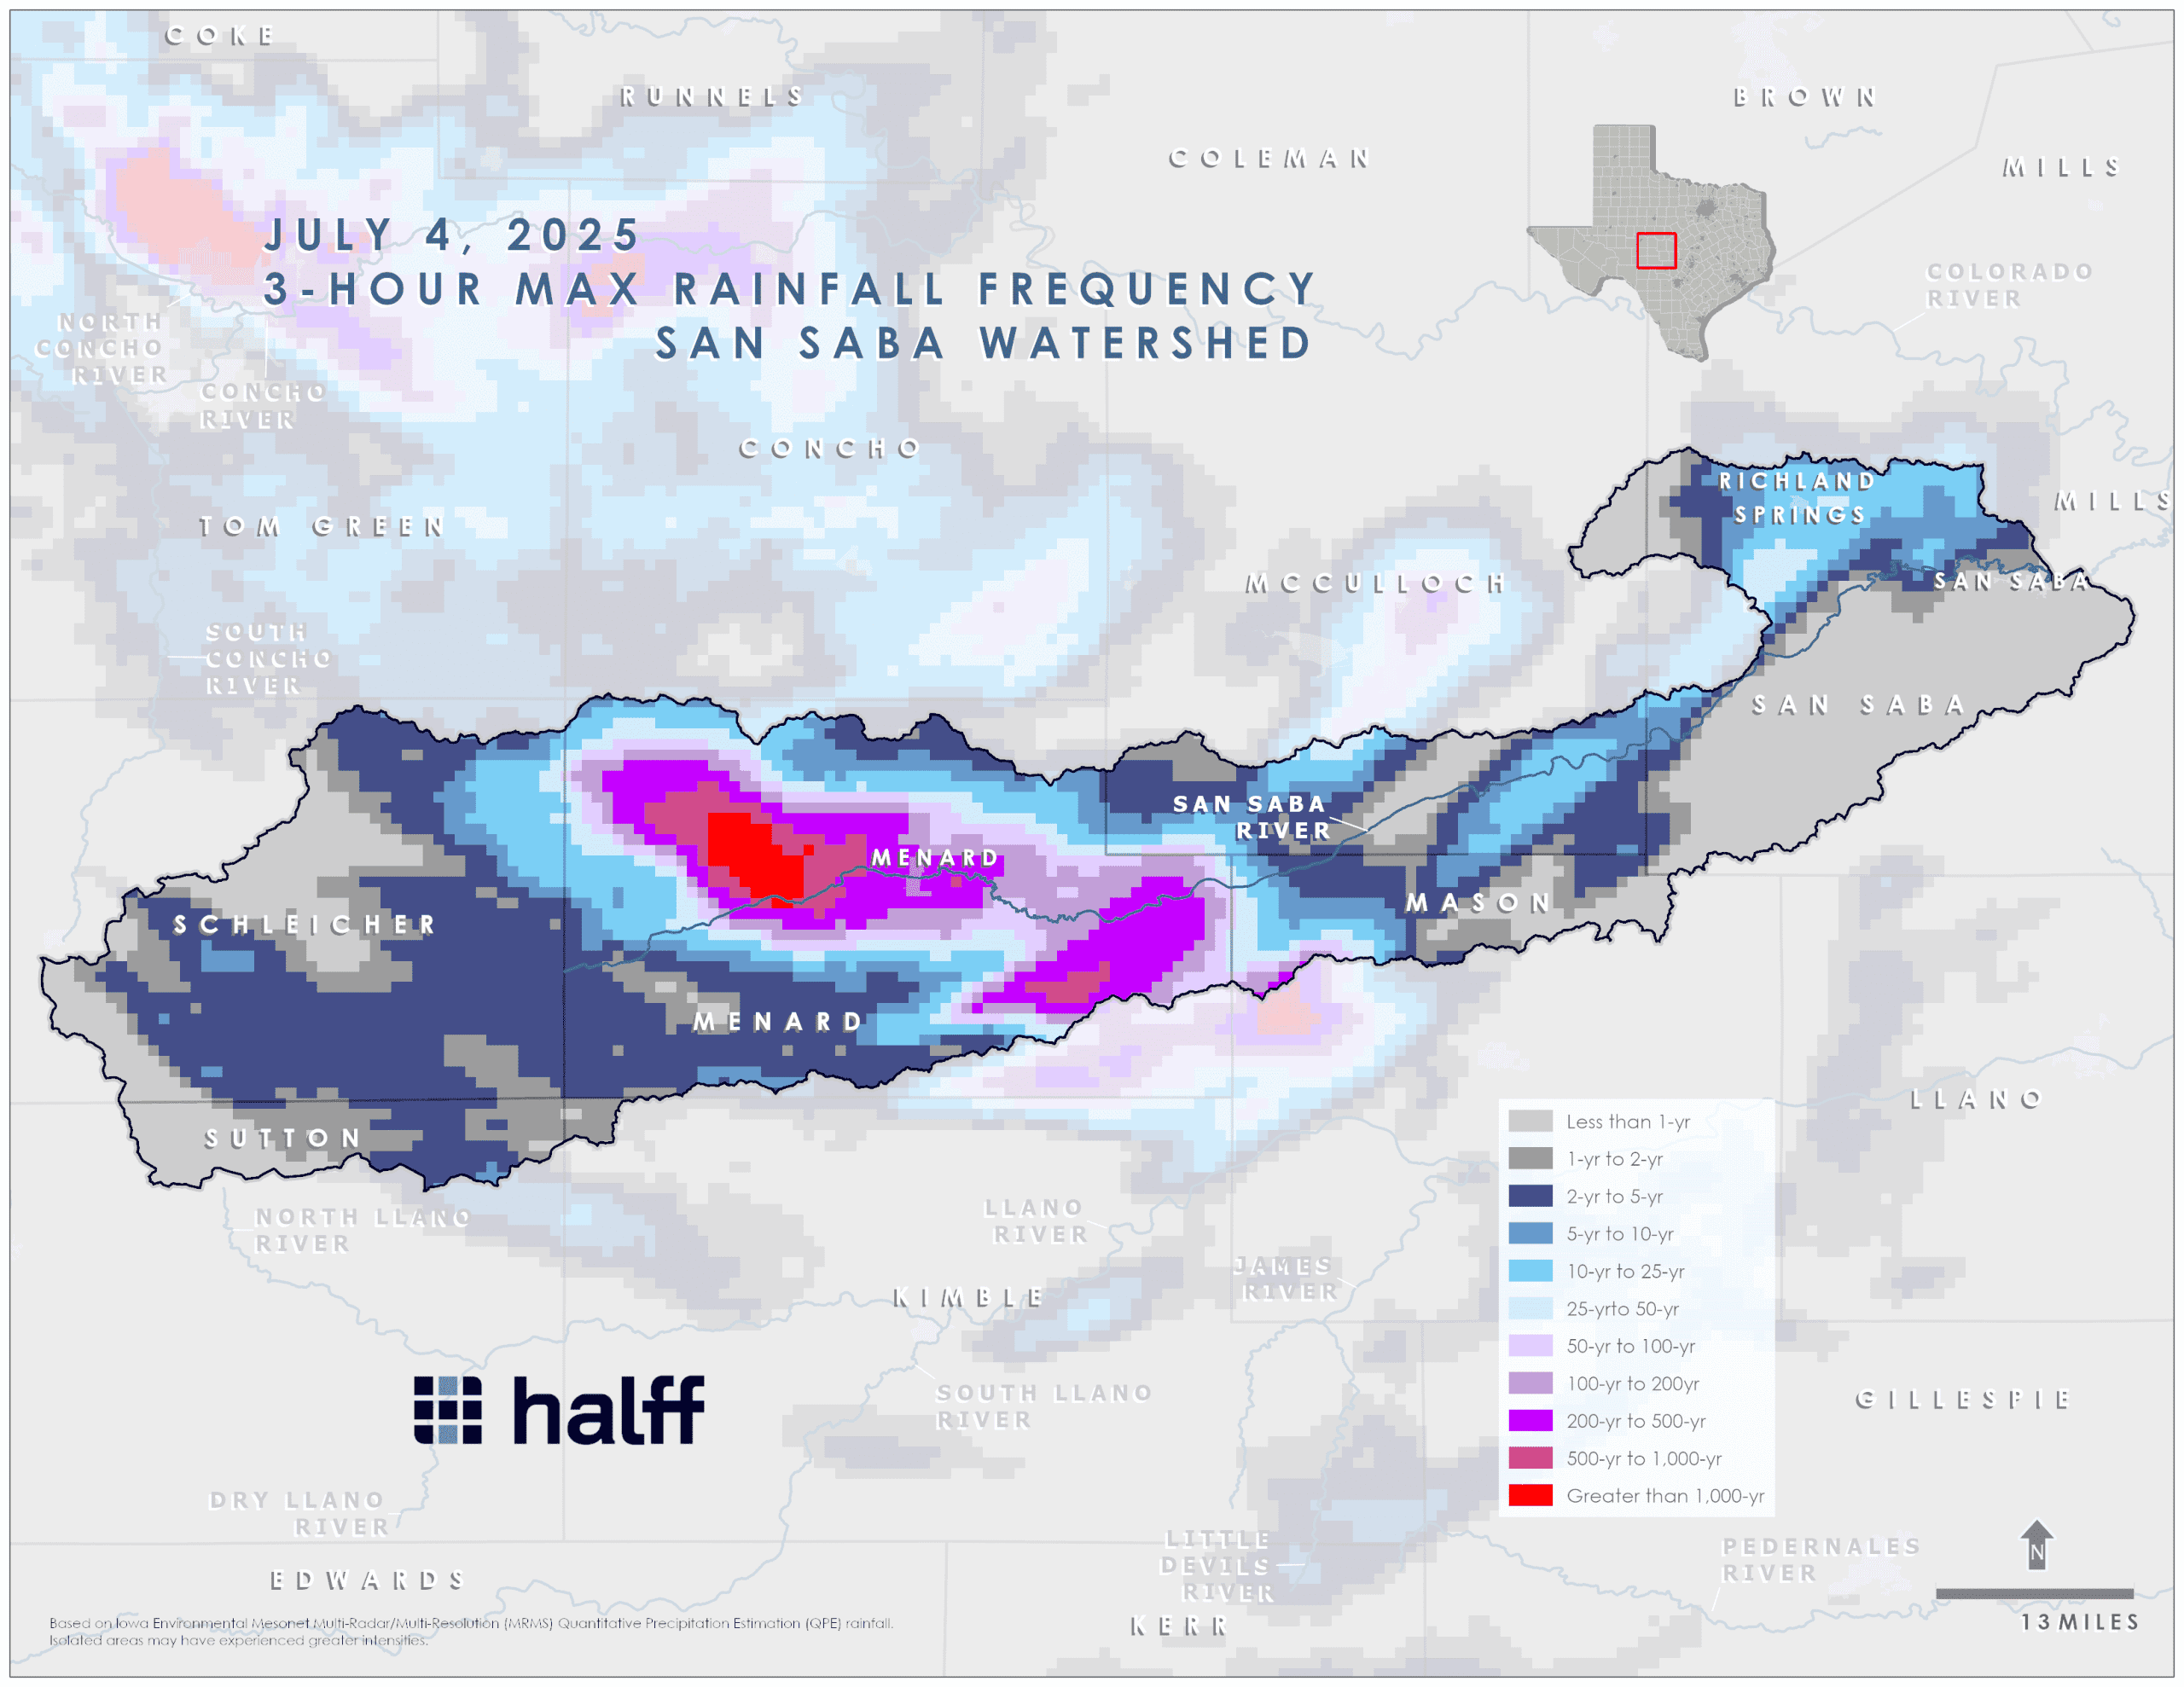
The most extreme frequencies in this watershed were observed in a three-hour duration.
Stream Gage Observations
As mentioned above, traditional floodplain modeling and mapping is typically based on the assumption that rainfall is distributed uniformly across an entire watershed over a 24-hour period. These July storms reinforced that all rain events are unique in terms of predicting when, where and how much it will rain.
Each of these factors have a tremendous influence on determining the risk of flooding. To evaluate resultant flood behavior, Halff performed rapid post-event modeling assessments in the Upper Guadalupe, San Gabriel and San Saba watersheds using the actual distributed rainfall patterns and evaluated stream gage records across Central Texas.
Assessing the Situation. Halff used the 2D BLE models to quickly assess the July flood events in the Upper Guadalupe, San Gabriel, and San Saba HUC8 watersheds. This assessment was conducted using available hourly gridded rainfall with minor adjustments to the available models to align with observed gage records.
These non-proprietary 2D BLE HEC-RAS models implement a rain-on-mesh approach with average infiltration, parameters-based land use and soil data. The available models initially underestimated flood elevations. However, removing or reducing infiltration to reflect soil conditions when it flooded aligned results with observed data in some models. This indicated that heavy rainfall on hard ground caused most water to flow directly into rivers and streams. These simulations do not consider the substantial debris observed during this flood. Observed peak water surface elevations and flood timing closely correspond to the modeled conditions, validating the model’s application for preliminary assessments.
The Central Texas USGS gage records were assessed to identify the peak flood elevations that could be compared to computed water surface elevations for various frequency events. Many of the observed gage elevations are greater than the FEMA 100-year water surface elevations. Several FEMA floodplains in Central Texas have not yet integrated the newly avaliable rainfall NOAA Atlas 14 data. Therefore, the comparisons displayed below are based on computed water surface elevations from BLE datasets that did incorporate the NOAA Atlas 14 rainfall.
USGS stream gages along the Guadalupe River, San Saba River, Brady Creek, San Gabriel River, Lake Creek and Brushy Creek experienced flood elevations near or above the 100-year BLE water surface elevations. This event is the greatest flood of record for the San Saba River near Brady, North Fork San Gabriel River near Leander, Guadalupe River at Hunt, Guadalupe River near Centerpoint and Guadalupe River near Bergheim.
Guadalupe Flooding Simulation
Along the Guadalupe River, flood depths exceeded the 100-year (1% chance of occurrence) event near Hunt and matched it near Kerrville. Since downstream areas did not experience further rainfall, the flood wave decreased below the 100-year level as it moved toward Comfort. Estimates suggest thousands of Kerr County buildings may have been affected by flood water. These simulations also help assess flood movement, extents, velocities and depths.
San Gabriel Flooding Simulation
There are limited stream gages in the headwaters of the San Gabriel watershed, where the majority of intense rainfall occurred. A significant flood wave advanced down the South Fork San Gabriel River, reaching near 100-year levels in Georgetown. Lake Creek and Brushy Creek near Copeland also reached near 100-year levels during this event.
San Saba Flooding Simulation
Although a substantial three-hour rainfall event took place just upstream of Menard, it was the extended duration rainfall near the Menard and Mason County boundary that caused the San Saba River to approach 100-year flood levels in both Brady and San Saba.
Conclusion
The 2025 July Fourth Weekend storms were devastating events that unleashed pockets of extreme rainfall across Central Texas. The resulting runoff generated dangerous flash floods and rapidly elevated river stages in multiple watersheds. The severity of the rainfall event ranged from 100-year to 1,000-year recurrence intervals in the most harshly affected areas. Some streams, particularly in intense rain-hit areas, experienced flood of record or water levels near or above the 100-year BLE water surface elevations.
At Halff, we recognize the toll this disaster has taken on families and communities. Our Water Resources professionals responded with urgency, applying trusted tools, professional judgment and compassion to provide timely assessments that can help guide recovery and planning. It is our mission to improve lives and communities — and in times of crisis, we stand ready to serve with integrity, technical excellence and care.
Recent Stories

Gravel Ridge and FSM Aircraft Arresting System Awarded Gold by ACEC Arkansas
LITTLE ROCK, Ark. — Three Halff projects collected 2026 American Council of Engineering Companies (ACEC) Arkansas Engineering Excellence Awards (EEA)….

Past to Present: The Importance of Surveying
In celebration of National Surveyors Week, we take time to commemorate some of the most interesting aspects of land surveying’s…